Резюме
Актуальність. З огляду на те, що відносний внесок різних факторів на ризик розвитку ретинопатії залишається невизначеним, є актуальними пошук і вивчення нових факторів ризику розвитку і прогресування діабетичної ретинопатії (ДРП) та їх модифікуючий вплив на компоненти метаболічного синдрому (МС) при цукровому діабеті (ЦД) 2-го типу. Мета: виконати порівняльну оцінку впливу деяких факторів прогресування ДРП на показники ліпідного обміну при МС. Матеріали та методи. Дослідження проведені в 64 пацієнтів (95 очей) із ЦД 2-го типу, МС і ДРП (чоловіки і жінки, середній вік — 61,55 ± 2,37 року, середня тривалість діабету — 11,20 ± 2,11 року, середній рівень HbA1с — 9,89 ± 0,78 %, середній індекс маси тіла — 34,55 ± 3,75 кг/м2), яких залежно від стадії ДРП розподілили на 3 групи. Результати. Модифікуючий вплив на рівень загального холестерину в крові у хворих із ЦД 2-го типу і ДРП справляють: вік пацієнтів (до 60 років), тривалість діабету (до десяти років), декомпенсація вуглеводного обміну — для третьої стадії ДРП, особливість терапії ЦД 2-го типу — для другої стадії ДРП; на рівень холестерину ліпопротеїнів низької щільності: молодший вік хворих, декомпенсація діабету — для третьої стадії ДРП, особливість гіпоглікемічної терапії (інсулінотерапія), менша тривалість діабету — для другої стадії ДРП; на рівень тригліцеридів: вік пацієнтів (до 60 років), тривалість діабету (до десяти років) і інсулінотерапія — для першої та третьої стадій ДРП. Висновки. Особливості цукрознижувальної терапії можуть слугувати новим фактором прогресування ДРП.
Актуальность. С учетом того, что относительный вклад различных факторов на риск развития ретинопатии остается неопределенным, являются актуальными поиск и изучение новых факторов риска развития и прогрессирования диабетической ретинопатии (ДРП) и их модифицирующее влияние на компоненты метаболического синдрома (МС) при сахарном диабете (СД) 2-го типа. Цель: выполнить сравнительную оценку влияния некоторых факторов прогрессирования ДРП на показатели липидного обмена при МС. Материалы и методы. Исследования проведены у 64 пациентов (95 глаз) с СД 2-го типа, МС и ДРП (мужчины и женщины, средний возраст — 61,55 ± 2,37 года, средняя длительность диабета — 11,23 ± 2,11 года, средний уровень HbA1с — 9,89 ± 0,78 %, средний индекс массы тела — 34,55 ± 3,75 кг/м2), которых в зависимости от стадии ДРП разделили на 3 группы. Результаты. Модифицирующее влияние на уровень общего холестерина в крови у больных с СД 2-го типа и ДРП оказывают: возраст пациентов (до 60 лет), длительность диабета (до десяти лет), декомпенсация углеводного обмена — для третьей стадии ДРП, особенность терапии СД 2-го типа — для второй стадии ДРП; на уровень холестерина липопротеинов низкой плотности: более молодой возраст больных, декомпенсация диабета — для третьей стадии ДРП, особенность гипогликемической терапии (инсулинотерапия), меньшая длительность диабета — для второй стадии ДРП; на уровень триглицеридов: возраст пациентов (до 60 лет), длительность диабета (до десяти лет) и инсулинотерапия — для первой и третьей стадий ДРП. Выводы. Особенности сахароснижающей терапии могут служить новым фактором прогрессии ДРП.
Background. The search and study of new risk factors for the development and progression of diabetic retinopathy (DRP) and their modifying influence on the components of metabolic syndrome in type 2 diabetes mellitus (T2DM) remain relevant. The purpose was to conduct a comparative evaluation of the impact of certain DRP development factors on indices of lipid metabolism in metabolic syndrome. Materials and methods. The research was carried out in 64 patients (95 eyes) with T2DM, metabolic syndrome and DRP (males and females, average age 61.55 ± 2.37 years, average duration of diabetes 11.23 ± 2.11 years, average level of HbA1c 9.89 ± 0.78 %, average body mass index 34.55 ± 3.75 kg/m2), who were divided into 3 groups depending on the stage of DRP. Results. Results had showed that the following factors have modifying influence on the level of total cholesterol in the blood of patients with T2DM and DRP: age of patients (under 60 years), duration of diabetes (less than 10 years), decompensation of carbohydrates metabolism — for the 3rd stage of DRP, features of therapy for T2DM (oral hypoglycemic drugs) — for the 2nd stage of DRP; on the level of low-density lipoprotein cholesterol: younger age of patients, decompensation of diabetes — for the 3rd stage of DRP, features of hypoglycemic therapy (insulin therapy), shorter duration of diabetes — for the 2nd stage of DRP; on the level of triglycerides: age of patients (under 60 years), duration of diabetes (less than 10 years) and insulin therapy — for the 1st and 3rd stages of DRP. Conclusions. It is concluded that features of hypoglycemic therapy can be a new modifying factor for the risk of DRP progression.
Introduction
Clinical and epidemiological studies which were carried out in Ukraine and abroad demonstrated the influence of hyperglycemia, arterial hypertension (АH) and dyslipidemia and to a lesser degree a high body mass index as well as a low level of physical activity and insulin-resistance on frequency of occurrence and development of diabetic retinopathy (DRP) [1, 14, 15]. However the level of glycated hemoglobin (HbA1c) is the most essential risk factor for development and progression of DRP, it represents only 11 % of risk for retinopathy [6]. Similar to HbA1c, AH and level of general cholesterol in blood serum together make up from 9 to 10 % of risk for deve–lopment of DRP [8]. Thus prophylaxis of complication of diabetes mellitus (DM) should include further examination of other modifying or non-modifying risk factors. Contemporary references also testify to the importance of other factors including obstructive sleep apnea, non-alcoholic fatty liver disease, level of prolactin, homocysteine and hormones of adipose tissue of blood serum [1, 2, 9–12, 16, 17], genetic factors and endothelial dysfunction in development of DRP [5, 13]. Considering the fact that the relative contribution of different factors to the risk of developing retinopathy remains uncertain, the search and study for new risk factors of development and progression of DRP and their modifying influence on components of the metabolic syndrome (MS) at T2DM remain actual.
Purpose. To conduct a comparative evaluation of influence of certain DRP development factors on indices of lipid metabolism at MS.
Materials and methods
The research was carried out on 64 patients (95 eyes) with T2DM, metabolic syndrome and DRP (males and females, average age 61.55 ± 2.37 years old, average duration of diabetes 11.23 ± 2.11 years, average level of HbA1c 9.89 ± 0.78 %, average BMI 34.55 ± 3.75 kg/m2), who were divided into 3 groups depending on the stage of DRP. The research was conducted according to World Medical Association Declaration of Helsinki (2008) and literary recommendations for inclusion criteria into the research of patients with obesity and T2DM [18]. MS, parameters of T2DM and dyslipidemia were estimated according to the criteria accepted by the WHO experts from National Health Institute of the USA (Adult Treatment Panel III, ATP III, 2001), recommendations of International Diabetes Federation (IDF), American Diabetes Association (ADA) (2013, 2015), European Society of Cardiology (ESC), European Atherosclerosis Society (EAS), Ukrainian Association of Cardiology (2011).
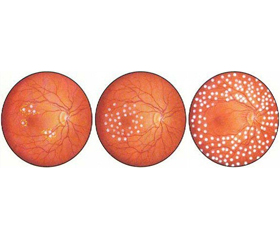
HbA1c was estimated by the analyzer D-10 (Bio-Rad, France/USA) by liquid ion exchange chromatography with high pressure using sets made by Bio-Rad (France/USA), triglycerides (TG), total cholesterol and its fractions — by the automatic biochemical analyzer Olympus AU400 (Beckman Coulter (USA)) using the method of spectrum photometry with reagents Оlympus AU400. All patients underwent complex ophthalmological examination: autorefractometry, visometry, tono–metry, perimetry, biomicroscopy, fundus photography and fluorescein fundus angiography. Diagnosis of diabetic retinopathy was established according to Order of Mi–nistry of Health of Ukraine as of 22 May 2009 N 356 (in the edition of Order of Ministry of Health of Ukraine as of 05 August 2009 N 574), in which it is recommended to use 3 main stages for diabetic retinopathy in ophthalmological work: non-proliferative, pre-proliferative and proliferative.
Results
Main biochemical clusters of MS in patients with T2DM depending on the stage of DRP and considering such factors as progression, age of patients, duration of T2DM, degree of compensation and applied hypo-glycemic therapy have been represented in tables 1–4.
At the age below 60 years old the highest average level of total cholesterol was diagnosed in patients at the 3rd stage of DRP, at the age over 60 — at the 2nd stage of DRP. The worst level of total cholesterol in those comparison groups was observed in patients at the age below 60 at the 3rd stage of DRP (6.68 mmol/l, and by CI — 7.99 mmol/l). Patients with the duration of diabetes less than 10 years and more than 10 years — the worst average level of total cholesterol was at the 3rd stage of DRP. The worst average level of total cholesterol in those comparison groups was observed in patients with the duration of diabetes less than 10 years at the 3rd stage of DRP (6.36 mmol/l, by CI — 7.51 mmol/l). Patients with subcompensation and decompensation of carbohydrates metabolism — the highest average level of total cholesterol was observed in patients at the 3rd stage of DRP. The worst average level of total cholesterol in those comparison groups was observed in patients with HbA1с > 8 % at the 3rd stage of DRP (6.32 mmol/l, and by CI — 7.49 mmol/l). In case of therapy by oral hypoglycemic drugs (OHGD) the highest average level of total cholesterol was observed in patients at the 2nd stage of DRP, in case of insulin therapy — at the 3rd stage of DRP. The worst average level of total cholesterol in the presented comparison groups was observed at the 2nd stage of DRP in patients who were prescribed OHGD (7.11 mmol/l, by CI — 8.87 mmol/l) (table 1).
At the age of over 60 years old the best average level of cholesterol HDLP was observed in patients at the 2nd stage of DRP. The worst total indicator of cholesterol HDLP among those comparison groups was observed in patients at the age below 60 years old at the 3rd stage of DRP (0.77 mmol/l by CI). Patients with the duration of diabetes less than 10 years had the best average level of cholesterol HDLP on the 2nd stage of DRP, patients with duration of diabetes over 10 years — at the 2nd and 3rd stages of DRP. The worst total index of cholesterol HDLP among the comparison groups was revealed in patients with the duration of diabetes less than 10 years at the 3rd stage of DRP (0.79 mmol/l by CI). At subcompensation and decompensation of DM patients had the highest average level of cholesterol HDLP at the 2nd stage of DRP. The worst absolute index of cholesterol HDLP among the comparison groups was revealed in patients with HbA1с > 8 % at the 3rd stage of DRP (0.83 mmol/l by CI). In case of treatment by OHGD the highest ave–rage level of cholesterol HDLP was revealed in patients at the 2nd and 3rd stages of DRP, in case of insulin the–rapy – at the 2nd stage of DRP. The worst total index of cholesterol HDLP among the comparison groups was observed at the 3rd stage of DRP in patients who received insulin therapy (0.83 mmol/l by CI) (table 2).
At the age below 60 years old, the highest average level of cholesterol LDLP was revealed in patients at the 3rd stage of DRP, at the age over 60 years old — at the 2nd stage of DRP. The worst level of cholesterol LDLP in the comparison groups was determined in patients at the age of below 60 years old at the 3rd stage of DRP (4.07 mmol/l and by CI — 4.95 mmol/l). In patients with the duration of diabetes over 10 years, the highest average level of cholesterol LDLP was revealed at the 2nd stage of DRP and in patients with the duration of diabetes over10 years — at the 1st and 3rd stages of DRP. The worst average level of cholesterol LDLP in the comparison groups was revealed in patients with the duration of diabetes less than 10 years at the 2nd stage of DRP (4.17 mmol/l, and by CI — 5.05 mmol/l). In patients with the level of HbA1с ≤ 8 % the highest average level of cholesterol LDLP was determined in patients at the 1st and 2nd stages of DRP, and at HbA1с more than 8 % — at the 3rd stage of DRP. The worst total index of cholesterol LDLP among the comparison groups was revealed in patients with HbA1с > 8 % at the 3rd stage of DRP (4.29 mmol/l, and by CI — 5.07 mmol/l). In case of therapy by OHGD the highest average level of cholesterol LDLP was determined in patients at the 2nd stage of DRP, in case of insulin therapy — at the 3rd stage of DRP. The worst average level of cholesterol LDLP in the comparison groups was observed at the 3rd stage of DRP in patients who received insulin therapy (4.53 mmol/l, and by CI — 5.27 mmol/l) (table 3).
At the age of 60 years old the highest average level of TG was revealed in patients at the 1st stage of DRP and at the age over 60 years old — at the 1st and 2nd stages of DRP. The worst level of TG in age comparison groups was determined in patients at the age of 60 years old at the 1st stage of DRP (2.95 mmol/l, and by CI at the 3rd stage — 4.19 mmol/l). In patients with the duration of diabetes less than 10 years the highest average level of TG was revealed at the 1st stage of DRP, and in patients with duration of diabetes over 10 years — the same as at the 1st stage of DRP. The worst average level of TG in comparison groups by the duration of diabetes was determined in patients with the duration of diabetes less than 10 years at the 1st stage of DRP (4.17 mmol/l, and by CI at the 3rd stage — 3.81 mmol/l). In patients with the level of HbA1c ≤ 8 % the highest average level of TG was revealed at the 1st stage of DRP, at HbA1c over 8 % — the same as at the 1st stage of DRP. The worst average level of TG among comparison groups by compensation of carbohydrate metabolism was determined in patients with HbA1c > 8 % at the 1st stage of DRP (2.57 mmol/l, and by CI — at the 2nd stage with the level of HbA1c ≤ 8 % — 3.72 mmol/l). In case of OHGD therapy the highest average level of TG was determined in patients at the 1st stage of DRP, in case of insulin therapy — the same as at the 1st stage of DRP. The worst average level of TG in comparison groups by the type of hypoglycemic therapy was determined at the 1st stage of DRP in patients who received insulin therapy (2.62 mmol/l and by CI — at the 2nd stage if OHGD is used — 4.26 mmol/l) (table 4).
Discussion
As the results of the statistical analysis showed, average indices of total cholesterol in blood in all comparison groups of patients with T2DM mainly exceeded the upper level of reference indices for patients without the risk for development of cardiovascular events and T2DM (less than 5–5.18 mmol/l) and mainly for patients with T2DM (less than 4.5 mmol/l); average indices of cholesterol HDLP in blood by stages of DRP were not lower than those of the recommended boundary value level in blood serum (less than 1.0 mmol/l) and were within normal values (1.03–1.55 mmol/l), average indices of cholesterol LDLP were higher than the norm (refe–rence values for healthy people 2.6–3.3 mmol/l) in 13 out of 24 comparison groups (54.1 %) and exceeded the higher reference value level, determined for patients with T2DM (less than 2.5 mmol/l), in 23 groups of patients (95.8 %), average indices of TG in blood of patients with DRP were higher than the norm (reference data for healthy people — 1.7 mmol/l) in 13 out of 24 comparison groups (54.1 %).
According to the results of comparative estimation for the influence of progression factors of DRP on indices of lipid metabolism in patients with T2DM and DRP we can notice that the most significant hypercholeste–rolemia (the worst level) is observed at the age of patients under 60 years old — at the 3rd stage of DRP (exceeding of target values for 48%), with the duration of diabetes less than 10 years — at the 3rd stage of DRP (exceeding target values by 41 %), in patients with decompensation of carbohydrate metabolism (HbA1c > 8 %) — at the 3rd stage of DRP (exceeding target values for 41%), in case of administration of OHGD — at the 2nd stage of DRP (exceeding target values by 58 %).
Most clinically significant increase in levels of cholesterol LDLP were determined at the age of patients under 60 years old — at the 3rd stage of DRP (exceeding target values by 62 %), with the duration of diabetes less than 10 years — at the 2nd stage of DRP (exceeding target va–lues by 67 %), in patients with decompensation of T2DM (HbA1c > 8 %) — at the 3rd stage of DRP (exceeding target values by 71 %), in case of insulin therapy — at the 3rd stage of DRP (exceeding target values by 80 %). The obtained results were supported by publications on interrelation between duration of diabetes and the level of HbA1c > 8 % with cholesterol LDLP [11].
Moreover by cholesterol HDLP the clinically significant decrease in its concentration in blood can be determined only by the confidence interval at the 3rd stage of DRP at the age of patients under 60 years old (decrease by 23 %), with the duration of diabetes less than 10 years (decrease by 21 %), at decompensation of carbohydrate metabolism (decrease by 17 %) and if insulin therapy was administered (decrease by 17 %). On the whole average levels of cholesterol HDLP remain relatively unfavorable without the influence on it from factors of DRP progression, which indicates probably their minimal contribution to the formation of endothelial dysfunction typical for diabetes.
Clinically significant hypertriglyceridemia was determined mainly only at the 1st stage of DRP (exceeding target values maximally — up to 73 %), and notably at the action of all the factors of DRP progression presented by us, with the exception of the age of patients under 60 years old, the factor of duration of diabetes less than 10 years and the factor of insulin therapy, when hypertriglyceridemia was revealed also at the 3rd stage of DRP (exceeding target values by 32–48 %).
Previous examination of clusters of MS in patients with T2DM and DRP showed that patients with DRP possess phenotypic and clinical-biochemical signs of MS: obesity (83.4 % patients) with the increased waist regardless of gender, AH (71.4 % patients), dyslipidemia (47.6 % patients), hypercholesterolemia (61.9 % patients) and hypertriglyceridemia (52.3 % patients). The authors suggest that hypertriglyceridemia is one of the trigger pathogenetic mechanisms for development of DRP [18]. In the world literature it has been shown that the severity of DRP is connected with the increased concentration of TG and inversely proportional to the level of cholesterol HDLP; it was also shown that fenofibrate decreased by 31 % the necessity for laser treatment of proliferative DRP, threatening eyesight of patients with T2DM [4]. The provided literature data correspond to our results.
We are inclined to consider that at the 1st stage of developing DRP hypertriglyceridemia takes part in the formation of endothelial dysfunction and provides idiosyncratic metabolic “hit” on rheological properties of blood and endothelium of vessels, contributing to the realization of the influence from such markers of endothelial damage and low-gradual inflammation as interleukin-8 [5, 13], inhibitor of activator of plasminogen-1 [3], vascular cell adhesion molecule type 1 [7], which are actively produced in the body in case of obesity. Hypercholesterolemia and dyslipidemia (by cholesterol LDLP), seemingly may lead to further progression of endothelial dysfunction by the type of the “second wave” at later stages of DRP. At that the modifying influence on those clusters of MS, as our own results showed, at different stages of DRP can be made by such factors as age of patients with T2DM, duration of the disease, degree of compensation and features of hypoglycemic therapy. It can be suggested that the type of hypoglycemic therapy can be the new factor for progression of DRP.
Conclusions
1. The modifying influence on the level of total cholesterol in blood of patients with T2DM and DRP is rendered by: age of patients (under 60 years old), factor of duration of diabetes (less than 10 years), factor of decompensation of carbohydrates metabolism — for the 3rd stage of DRP, features of therapy for T2DM (OHGD) — at the 2nd stage of DRP; on the level of atherogenic cholesterol LDLP: younger age of patients, decompensation of diabetes — for the 3rd stage of DRP, features of hypoglycemic therapy (insulin therapy), shorter duration of diabetes — for the 2nd stage of DRP; on the level of TG: age of patients (under 60 years old), factor of duration of diabetes (less than 10 years) and factor of insulin therapy — for the 1st and 3rd stages of DRP.
2. Features of hypoglycemic therapy can represent a new modifying factor for the risk of DRP progression.
Conflicts of interests. Authors declare the absence of any conflicts of interests that might be construed to influence the results or interpretation of their manuscript.
Список литературы
1. Antonetti D.A., Klein R., Gardner T.W. Diabetic Retino–pathy // N. Engl. J. Med. — 2012. — Vol. 366. — P. 1227-39.
2. Arnold E., Rivera J.C., Thebault S. et al. High levels of serum prolactin protect against diabetic retinopathy by increasing ocular vasoinhibins // Diabetes. — 2010. — Vol. 59. — P. 3192-7.
3. Azad N., Agrawal L., Emanuele N.V. et al. VADT Study Group. Association of PAI-1 and fibrinogen with diabetic retinopathy in the Veterans Affairs Diabetes Trial (VADT) // Diabetes Care. — 2014. — Vol. 37(2). — P. 501-6. — doi: 10.2337/dc13-1193.
4. Ning C., Mitchell P., Wong T.Y. Diabetic retinopathy // The Lancet. — 2010. — Vol. 376(9735). — P. 124-36.
5. Dong L., Bai J., Jiang X. et al. The gene polymorphisms of IL-8(-251T/A) and IP-10(-1596C/T) are associated with susceptibility and progression of type 2 diabetic retinopathy in –northern Chinese population // Eye. — 2017. — Vol. 31. — P. 601-7. — doi: 10.1038/eye.2016.287.
6. Hirsch I.B., Brownlee M. Beyond hemoglobin A1c — need for additional markers of risk for diabetic microvascular complications // JAMA. — 2010. — Vol. 303. — P. 2291-2.
7. Hughes J.M., Brink A., Witmer A.N. et al. Vascular leucocyte adhesion molecules unaltered in the human retina in diabetes // Br. J. Ophthalmol. — 2004. — Vol. 88. — P. 566-572. — doi: 10.1136/bjo.2003.021204.
8. Klein R. The epidemiology of diabetic retinopathy // Diabetic retinopathy / Ed. by Duh E. — Totowa, NJ: Humana, 2008. — P. 67-107.
9. Nguyen T.T., Alibrahim E., Islam F.M. et al. Inflammatory, hemostatic, and other novel biomarkers for diabetic retinopathy: the multi-ethnic study of atherosclerosis // Diabetes Care. — 2009. — Vol. 32. — P. 1704-9.
10. Targher G., Bertolini L., Chonchol M. et al. Non-alcoholic fatty liver disease is independently associated with an increased prevalence of chronic kidney disease and retinopathy in type 1 diabetic patients // Diabetologia. — 2010. — Vol. 53. — P. 1341-8.
11. West S.D., Groves D.C., Lipinski H.J. et al. The prevalence of retinopathy in men with Type 2 diabetes and obstructive sleep apnea // Diabet Med. — 2010. — Vol. 27. — P. 423-30.
12. Zietz B., Buechler C., Kobuch K. et al. Serum levels of adiponectin are associated with diabetic retinopathy and with adiponectin gene mutations in Caucasian patients with diabetes mellitus type 2 // Exp. Clin. Endocrinol. Diabetes. — 2008. — Vol. 116. — P. 532-6.
13. Витовская О.П., Ахмад Т.С., Бычкова Н.Г. Нарушения цитокиновой регуляции у пациентов с диабетической ретинопатией // Український медичний часопис. — 2016. — № 6(116). — XI/XII. — С. 93-95.
14. Малачкова Н.В., Комаровская И.В., Кирилюк М.Л. Уровень гликемии и инсулинорезистентности у больных с сахарным диабетом 2-го типа, диабетической ретинопатией и ожирением // Міжнародний ендокринологічний журнал. — 2017. — Т. 13(3). — С. 27-32. — doi: 10.22141/2224-0721.13.3.2017.104108.
15. Малачкова Н.В., Кирилюк М.Л., Комаровская И.В. Особенности артериального давления у больных диабетической ретинопатией, сахарным диабетом 2 типа и ожирением // Архів офтальмології України. — 2017. — Т. 5, № 1(7). — С. 32-37.
16. Малачкова Н.В., Кирилюк М.Л., Комаровская И.В. Связь уровня резистина в крови пациентов с диабетической ретинопатией при сахарном диабете ІІ типа в сочетании с ожирением // Офтальмологический журнал. — 2017. — № 4. — С. 9-13.
17. Сердюк В.Н., Ищенко В.А. Содержание лептина в крови у пациентов с сахарным диабетом 2-го типа на разных стадиях диабетической ретинопатии // Офтальмологія. — 2017. — № 1(6). — С. 46-54.
18. Сердюк В.Н., Ищенко В.А. Морфометрические и биохимические кластеры метаболического синдрома у пациентов с сахарным диабетом 2-го типа на разных стадиях диабетической ретинопатии // Міжнародний ендокринологічний журнал. — 2016. — № 7(79). — С. 69-74. — doi: 10.22141/2224-0721.7.79.2016.86421.